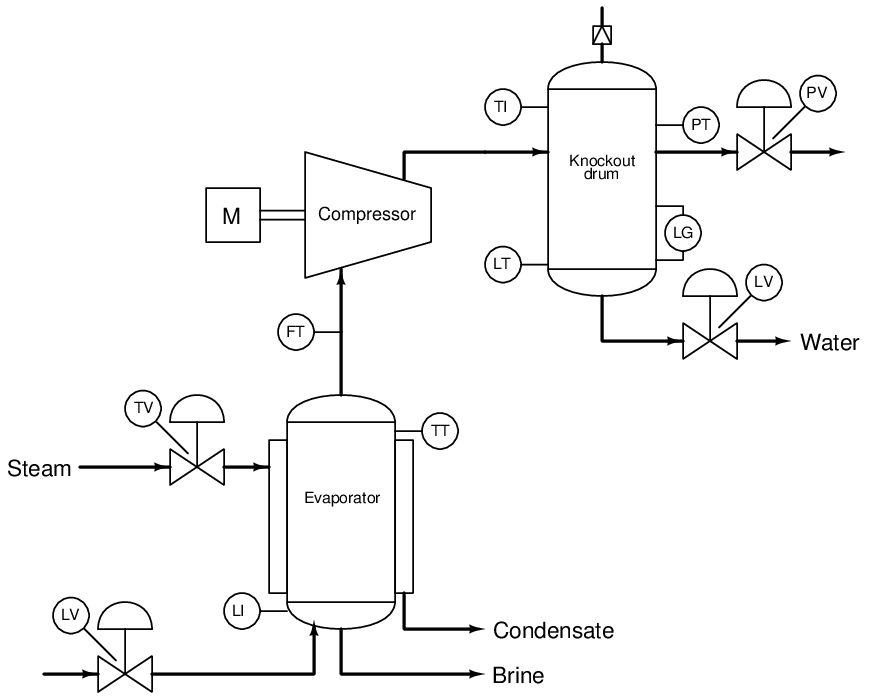
To show a practical process example, let’s examine three diagrams for a compressor control system, beginning with a Process Flow Diagram, or PFD. In this fictitious process, water is being evaporated from a process solution under partial vacuum (provided by the compressor). The compressor then transports the vapors to a “knockout drum” where they condense into liquid form. As a typical PFD, this diagram shows the major interconnections of process vessels and equipment, but omits details such as instrument signal lines and auxiliary instruments:

One might guess the instrument interconnections based on the instruments’ labels. For instance, a good guess would be that the level transmitter (LT) on the bottom of the knockout drum might send the signal that eventually controls the level valve (LV) on the bottom of that same vessel. One might also guess that the temperature transmitter (TT) on the top of the evaporator might be part of the temperature control system that lets steam into the heating jacket of that vessel.
Based on this diagram alone, one would be hard-pressed to determine what control system, if any, controls the compressor itself. All the PFD shows relating directly to the compressor is a flow transmitter (FT) on the suction line. This level of uncertainty is perfectly acceptable for a PFD, because its purpose is merely to show the general flow of the process itself, and only a bare minimum of control instrumentation.
7.2 Process and Instrument Diagrams
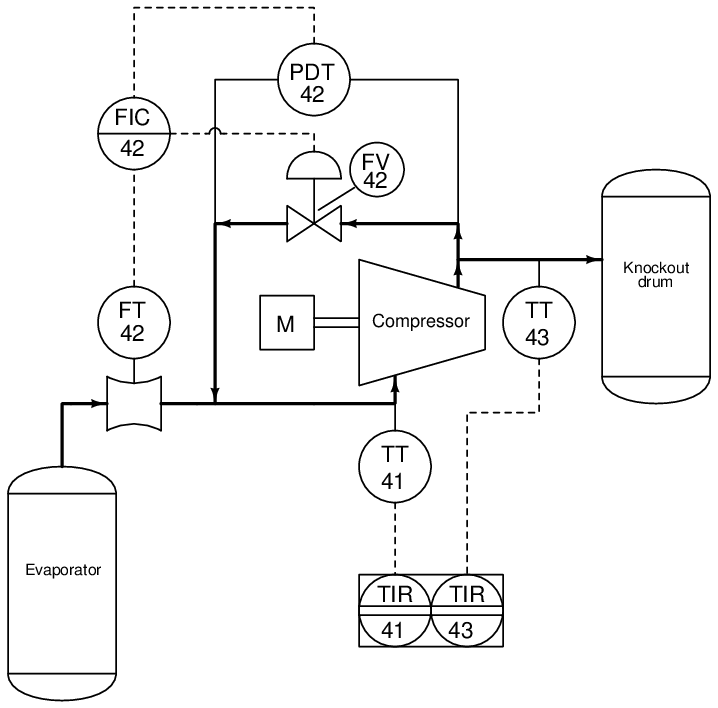
The next level of detail is the Process and Instrument Diagram1 , or P&ID. Here, we see a “zooming in” of scope from the whole evaporator process to the compressor as a unit. The evaporator and knockout vessels almost fade into the background, with their associated instruments absent from view2 :

Now we see there is more instrumentation associated with the compressor than just a flow transmitter. There is also a differential pressure transmitter (PDT), a flow indicating controller (FIC), and a “recycle” control valve allowing some of the vapor coming out of the compressor’s discharge line to go back around into the compressor’s suction line. Additionally, we have a pair of temperature transmitters reporting suction and discharge line temperatures to an indicating recorder.
Some other noteworthy details emerge in the P&ID as well. We see that the flow transmitter, flow controller, pressure transmitter, and flow valve all bear a common number: 42. This common “loop number” indicates these four instruments are all part of the same control system. An instrument with any other loop number is part of a different control system, measuring and/or controlling some other function in the process. Examples of this include the two temperature transmitters and their respective recorders, bearing the loop numbers 41 and 43.
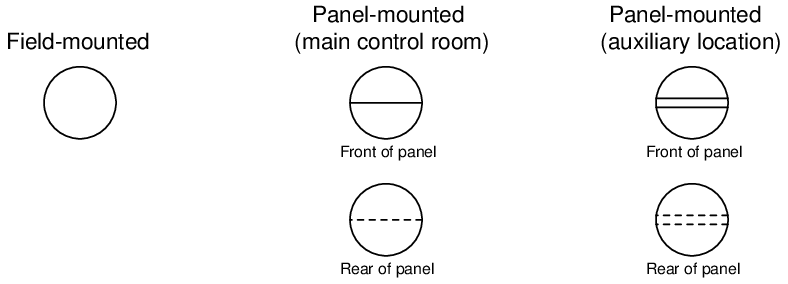
Please note the differences in the instrument “bubbles” as shown on this P&ID. Some of the bubbles are just open circles, where others have lines going through the middle. Each of these symbols has meaning according to the ISA (Instrumentation, Systems, and Automation society) standard:

The type of “bubble” used for each instrument tells us something about its location. This, obviously, is quite important when working in a facility with many thousands of instruments scattered over acres of facility area, structures, and buildings.
The rectangular box enclosing both temperature recorders shows they are part of the same physical instrument. In other words, this indicates there is really only one temperature recorder instrument, and that it plots both suction and discharge temperatures (most likely on the same trend graph). This suggests that each bubble may not necessarily represent a discrete, physical instrument, but rather an instrument function that may reside in a multi-function device.
Details we do not see on this P&ID include cable types, wire numbers, terminal blocks, junction boxes, instrument calibration ranges, failure modes, power sources, and the like. To examine this level of detail, we must turn to another document called a loop diagram.